Assessing the strength of communities in Essex

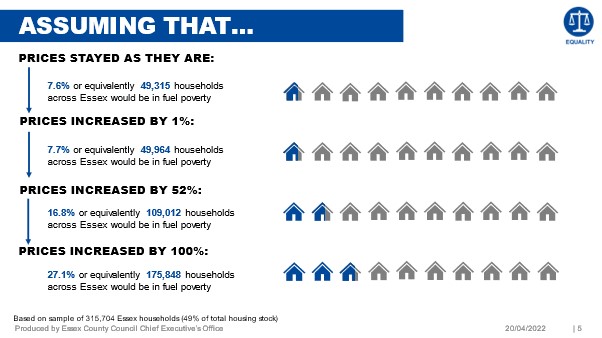
We commissioned Oxford Consultants for Social Inclusion (OCSI) to undertake a review of community need and ‘left behind’ areas in Essex. The review sought to help us understand how Essex compares to other areas in terms of its levels of community need, and which factors are more significant than others in contributing to areas having high levels of need.

Visualising data in R - Part 2

In the age of 'fake news', making accurate, attractive, and informative plots is essential in bridging the gap between people and data. In Part 2 of his blog, Dr Dave Clark, takes us through the possibilities of visualising data using R so that we can tell an impactful story.

How hard can it be?

“How hard can it be?” That is my thought process when I come to approaching new challenges. If I’m able to see others excelling at one thing, I know that with enough time and practice I’ll be able to replicate what they can do. So, when I was asked to create a Power BI dashboard to enable ECC to share the residents’ survey data, “how hard can it be?”, came straight into my head.  

How can we better look after our own wellbeing as researchers?

Over the last year or so our team has carried out research around Covid-19, mental health, financial struggles, women’s safety and domestic abuse among other things. This has involved participants discussing past traumas and difficult periods they have experienced, which can leave us as researchers often dwelling on those conversations long after they have taken place...