So, what is a Gini, and can it grant me three wishes..?
A Gini coefficient is an economic measure used to describe how a resource is distributed among a population. It allows us to see when a resource is not evenly shared among people. 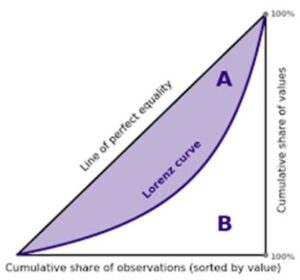
Traditionally it is used to understand inequality of income but can be applied to many things. A Gini coefficient will give you a score from 0 to 1, with 1 indicating absolute inequality and 0 representing perfect equality.
Scores are represented by a Lorenz curve, as seen in the graph to the right. The more unequal something is, the bigger the curve. The Gini coefficient is a measure of the size of this curve.
So, can it grant wishes? Well yes it can …
…I wish you could tell me more about what you did…
Of course! We gathered data from several sources and used the Dineq package in R to calculate Gini coefficients for every local authority area in the country. This gave us an idea of the spread of inequality nationally, and how Essex districts rank by comparison.
We created Gini coefficients in the domains of income, employment, education and health using the following open data sources:
- Income at MSOA level from 2018
- Rate per 1,000 people in employment deprivation (those claiming some form of unemployment benefit) from 2019
- Rate per 1,000 people not entering higher education from 2019
- Years of potential life lost from 2019.
I wish I knew more about inequality in Essex…
For income inequality, Colchester is the most unequal in Essex, and ranks 105th nationally, placing in the top third most unequal local authority areas nationally. This is followed by Castle Point (ranked 113th) and Basildon (ranked 115th).
In terms of unemployment inequality, Basildon is the most unequal in Essex, experiencing inequalities between areas in the numbers of people in and out of work. Basildon is ranked 69th nationally, placing it in the top quarter most unequal local authority areas nationally. Tendring was the second most unequal in Essex (ranking 124th nationally), followed by Chelmsford (ranked 131st).
Colchester is the most unequal area in Essex for our health measure, ranking 104th nationally, again placing it in the top third most unequal nationally. This is followed by Tendring (ranked 127th) and Basildon (ranked 132nd).
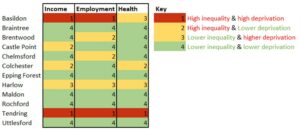
We then plotted local authority area Gini scores against their average rank in the Indices of Deprivation 2019, to see which areas experienced both higher inequality and higher than average deprivation.
Tendring experiences high inequality and high deprivation in income, employment, and health. Basildon has high inequality and deprivation in income and employment, but for health has high deprivation, which is spread fairly evenly throughout the district, which is of concern.
Braintree, Epping Forest, Maldon, Rochford and Uttlesford all experience low inequality and low deprivation.
I wish I could visualise inequality across the country…
Your wish is my command! We have developed an interactive tool that allows you to see what inequality looks like for local authority areas in England, available now on our Open Data platform.
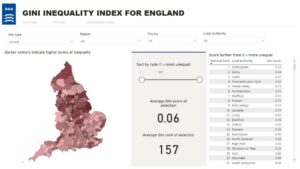
You can rank local authority areas by different forms of inequality, and filter by region and county, allowing you to compare how local authorities in different parts of the country score.
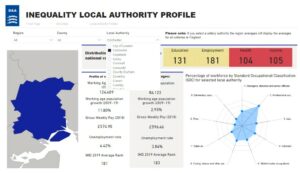
The dashboard also features a profile page that provides more detail about the economy of each local authority area, showing summary statistics about the working age population and its growth over the past 10 years, average gross weekly wage, unemployment rates, average Indices of Multiple Deprivation 2019 rank and proportion of workforce by occupational classifications.
Now my wishes have been granted, what next?
The Gini coefficient offers us a different lens to understand inequality in our districts. Combined with other datasets, including the Indices of Deprivation, it provides a rounded picture about which areas not only experience problems with deprivation, but also the unequal distribution of the kind of resources that can help lift people out of deprivation. With ECC’s focus on levelling up as part of its Everyone’s Essex strategy 2021-25, this offers us greater understanding of the challenges in our communities, which can be used to address inequality across the county.
1 comment
Comment by Dr Paul Kiff posted on
Developing a Gini coefficient for Greater London was my first ever job in Local Government in 1970 when working for the GLC. We also tracked its path over time to see whether inequality was increasing or not
No microcomputers in those days so all had to be done by hand
Pleasing to see that my daughter Tricia Smith has worked on it too 52 years later!!!
Dr Paul Kiff