Our cloud has many silver linings
As we move closer to wrapping up 2023, I find myself in a reflective mood! If you read last week’s blog you’ll have heard from my colleague Lee Burton that we have recently concluded the migration of 800GB of ECC …
As we move closer to wrapping up 2023, I find myself in a reflective mood! If you read last week’s blog you’ll have heard from my colleague Lee Burton that we have recently concluded the migration of 800GB of ECC …
In what feels like a long time ago now I wrote a blog around how excited I was about the planned migration of our on-premise data environment to the cloud. I was full of hope and dreams, and then we …

The exponential growth of data in the world, from a few spots of datum to a deep, expansive ocean of 1s and 0s, shows no sign of slowing and is expected to shape the world in ways we are still …
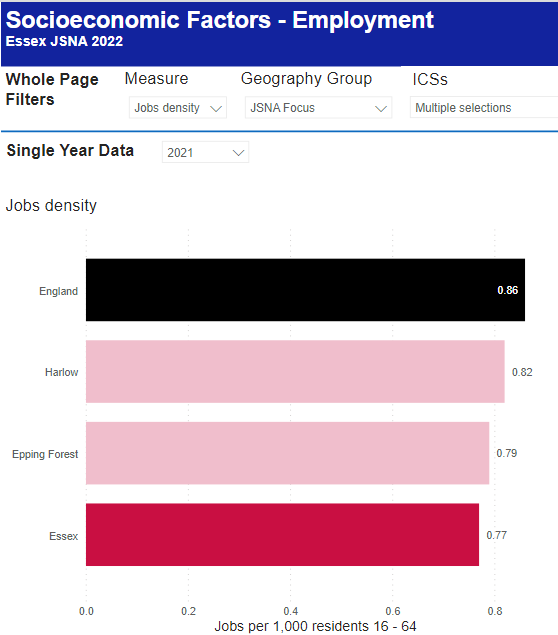
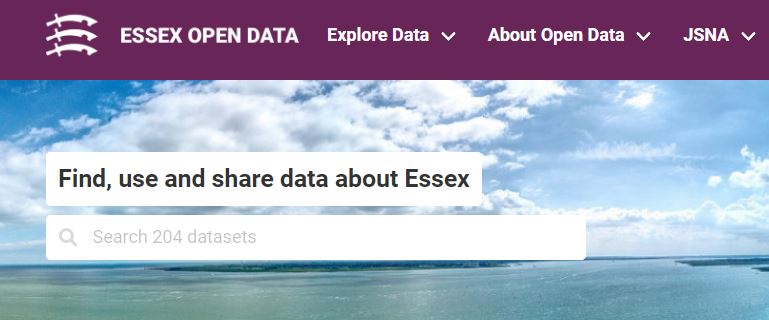
It has been some time since we launched our Joint Strategic Needs Assessment (JSNA) reports and interactive dashboards, but as the time goes by, things change. Read on to find out what’s new! This includes a new ICBs filter to our dashboards, new measures added, and data updates.

The situation The volume of Freedom of Information (FOI) requests the Council receives is huge. In the 43 months from December 2019 to July 2023, Essex County Council (ECC) received more than 6,000 FOI requests. This meant that on average, …

What happens when the one person who has all the knowledge on a certain process leaves your team? Panic? That “this is fine” meme (you all know the one)? Or take a breath and look for any opportunities to review …
Essex County Council is massive. There are around 12,000 employees. It’s the second biggest local authority in the country, geographically, and it’s the second largest spending authority (which makes sense, given the size thing I just mentioned). There are hundreds …

Council tax is inherently ‘unsexy’. It doesn’t hit the headlines all too often, let alone national news. In the media it’s an oft-neglected, much-maligned thing. In fact, you’re probably already thinking of closing this blog. Why on Earth would I …
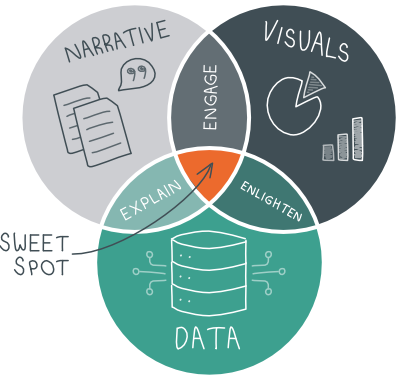
In the age of 'fake news', making accurate, attractive, and informative plots is essential in bridging the gap between people and data. In Part 2 of his blog, Dr Dave Clark, takes us through the possibilities of visualising data using R so that we can tell an impactful story.
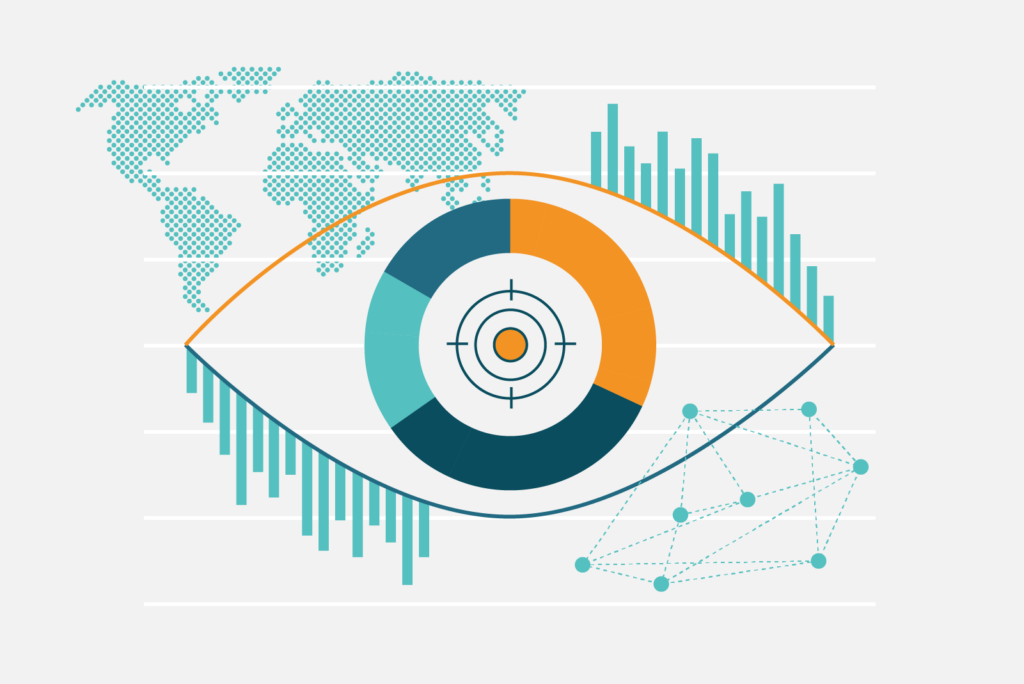
Dr Dave Clark, a researcher within the School of Life Sciences and Institute for Analytics and Data Science at the University of Essex answers our challenge: How can I build visualisations that can easily be tuned to different audiences?