“How hard can it be?” That is my thought process when I come to approaching new challenges. If I’m able to see others excelling at one thing, I know that with enough time and practice I’ll be able to replicate what they can do. So, when I was asked to create a Power BI dashboard to enable ECC to share the residents’ survey data, “how hard can it be?”, came straight into my head.
Although I’m a Research Intern at ECC, I work with the Open Data team to publicise research. Sharing the data from the residents' survey gives everyone the chance to gain an understanding of the needs/wants of the people of Essex. It is also a great opportunity to showcase the great work we do in Research and Open Data.
Taking stuff apart and seeing the internal workings of something, has always been my instinct. I like to know how someone was able to get from A to B.
To publish the dashboard I needed to first learn Power BI! At university we used statistical program called ‘Stata’, which was used to create statistical tables and linear regression models. At first, it was hard learning to code. But, once you practice over and over, and create your own models. It’s a great feeling of achievement. This was a similar process to learning the basics of Power BI.
I should explain what Power BI is and why we use it at Essex County Council. Power BI is an interactive visualisation tool. It can be used to show sales data, survey results, analytical data (e.g. COVID figures), and much more. The power then comes from being able to splice/filter the data down to the users liking. In this case it enables us to gather further insights from the data and understand the wants and needs of Essex communities better. Insights can then be used to shape future policy making. Another positive impact from Power BI is being able to show everyone the great work Essex County Council do.
When learning something new, it’s like building a house. You start digging down to lay the foundations before you can build up. Many hours of watching YouTube videos and scrolling through forums ensued. But sometimes the internet wasn’t helping. A big thanks must go to my colleagues from Data & Analytics, Ed Smith and Sorin Bobeica, who were always on hand to give me tips/tricks when needed. I just hope I didn’t annoy them too much. We work together closely in Open Data so all of us were eager to share the data with the public in an interactive and useful way.
Using Power BI taught me to think differently. Solutions came by looking at things from a different perspective. I understood how the software wanted to execute instructions and the format it desired to avoid errors. I learned I needed to ‘unpivot data’ in my first couple of days of learning, so that all questions I wanted modelling were all in one column and not multiple columns.
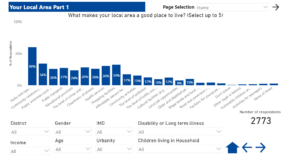
The dashboard also contains a set of filters so users can splice data by a particular district, gender, household income and whether the respondents live in rural or urban Essex. The dashboard also contains an ‘Essex Total’ button, which uses the clever effect of bookmarks within Power BI so users can toggle between a total Essex output, and a district split down. Power BI also taught me about creating data relationships between two different data sets or tables.

The one takeaway from doing this dashboard, is making yourself available for new challenges. Give it a go and you’ll become a better person from doing so. I’ll look to carry this mentality forward into my final year at university, where I’ll be writing my dissertation.
I also hope to inspire the next interns to learn about this great tool, that is Power BI. Along with the purpose of Open Data and the importance of local authorities showing transparency, collaboration, and innovation. I hope this blog will challenge others to jump into the deep end and think, “How hard can it be?”.
So, the dashboard in question is the ‘Residents Survey 2020 Dashboard’, which is on our Open Data platform. Take a look here: https://data.essex.gov.uk/dataset/20m99/essex-residents-survey
Leave a comment