So, first you’re probably thinking, what is Dineq? Well let’s deal with that first. Dineq is a package in R that enables you to run Gini functions. Gini coefficients are traditionally used to look at inequality across income in populations, but it can be used on a whole range of measures. It is one of many packages in R that can tell you more about your data, I’ll tell you more about that later…
Next you might be thinking why did I choose to learn R having returned from maternity leave and why am I telling you about my R journey? Maternity leave is nothing new, women return from maternity leave all the time, right?
Well, I wanted to share my story to encourage those of you have gone through life changes or face challenging times, whatever they might be and have been putting off learning something new or have thought learning R is something you would like to do, but you don’t know where to start.
Returning to work following a long time off is not always easy but returning during a pandemic to working from home full time made this even more of a challenge: not just because you don’t actually return, but in my case because when I returned my preferred piece of software (SPSS) was no longer available. I had heard of R for many years and had undertaken an introduction to R course before going on maternity leave but had never taken the next step. So I had a choice to make … I could shy away, or I could take the opportunity to learn more and put my learning into practice. For me the choice was simple, I had to learn more. But why would I choose such a challenging time to learn R? I often ask myself this question but I think this quote from Philosopher Eric Hoffer partly explains my reasons…
In times of change learners inherit the earth; while the learned find themselves beautifully equipped to deal with a world that no longer exists.
…So where did I start?
Well fortunately we have access to DataCamp here at Essex County Council so I started with the Introduction to R module. The good news is that this module is currently free to everyone, no matter where you work. This gave me a good refresher of some basics, including learning about data types, how to view the structure of your data and understand how variables are distributed.
Next, I learnt how to import data using the read.csv function and started to use some basic functions to view data. Following this I wanted to know more about visualising outputs as I’m more of a visual person so undertook the ggplot module in DataCamp. Next, I started to work with colleagues in the team on various projects to become familiar with how analysis is undertaken within R. And I undertook some further training on running regression analysis in R through the Social Research Association. This was a brilliant course, and these activities gave me a great start, but there is nothing that can substitute getting hands on with data so my next step was to try and run my own analysis in R!
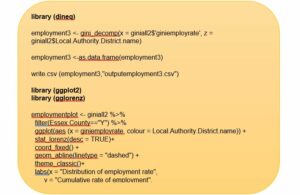
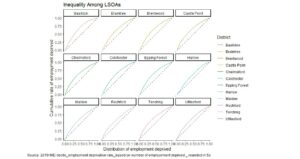
My next endeavour involved running some analysis using the Gini coefficient to understand inequalities in Health (Years of Life lost), Education (entering higher education) and employment (employment deprived) across Essex and the UK. One important thing to remember in R is that you nearly always need to load certain packages to run your analysis. The key package for this analysis was ‘Dineq’. Within this package you need to use the function ‘gini.decomp’ to produce gini coefficients for your variable of interest. It’s a fairly simple bit of code but you may also need to save the outputs for later use and visualise your data in some way. There is more to R than meets the eye. My code below shows you how to run the gini code, save the outputs to an Excel file (which was later imported into Power BI) and visualise the analysis in R using ‘gglorenz’.
… With a little help (sometimes a lot) from fantastic colleagues and after some blood, sweat and real tears I finally did it! I loaded some data, I wrote some code, I produced some outputs, I used the ggplot2 and ‘gglorenz’ packages to produce some lovely charts. I had achieved my initial aim and have started my journey to becoming proficient in R!
(Another useful way to visualise this analysis is in a Power BI dashboard. A dashboard is currently in development and will be made available on Essex open data so keep an eye out!)
Where to next with R? I have some interesting projects coming up where I am hoping to use some other techniques, such as regression analysis, so in preparation I have been learning the code needed for running regression and importantly the associated post diagnostic tests. I hope to continue to learn what I can and want to encourage others who are thinking of doing the same. I’m not going to lie, I don’t think it’s going to be easy, there is still so much to learn, R can be temperamental, and the language and code can be confusing. However, just like babies, once you learn to understand the language, everything starts to make sense and becomes more natural.
One final thought I will leave you with are some words I saw on a recent visit to Bletchley park (that’s the place some very clever data science people broke the German code)…
professors, however intelligent, are not professional Codebreakers
…What this meant is that they had to be trained to break the code, they didn’t turn up knowing how to do it. This one sentence gave me an enormous sense of wellbeing and achievement and I hope it does for you too.
Leave a comment