Anyone that knows me knows that I have a love-hate relationship with forecasting (similar to Tottenham & Ivory Coast fullback Serge Aurier).
(And (***shameless plug alert***) you can find out why by watching this video presentation!).
It essentially boils down to one famous paraphrased quote from British Statistician George E.P. Box:
All (forecast) models are wrong, but some are useful.

(Left; George E.P. Box; Right; Serge Aurier)
Like with all local authorities we want to know how our services might be impacted by Covid-19 and the accompanying environment we find ourselves in. We at ECC have been using forecasts to help us understand and plan for the future by creating demand scenarios across adult and children’s services, helping us to prepare for Covid-19 recovery.
My 2020 catchphrase has been “Forecasting is 50% science, 50% art-form”. And by that I mean that forecasts should be as evidence based as possible, through analysis, data science methods, research and literature, etc, - but ultimately you also need to make adjustments based on what practitioners and subject matter experts are seeing ‘on the ground floor’. Both of these components are required.
If anyone is making decisions (forecasting or otherwise) purely based on anecdote, or what a couple of people are experiencing, then (and I'm not going to sugar coat my words here) they are making wrong decisions, and it will eventually come back to haunt them!
So, here are my four top tips to help bring together ‘data science’ and ‘art’ to forecast short-to-medium term impact on public sector services at Essex County Council.
(FYI – these fly in the face of social distancing guidelines a little – but I think we are all overdue a little of the following…)
KISS – Keep It Simple Stupid
CARESS – Change is Always Rare, Everything Stays the Same
LOVE – Look at Observed Values vs Expected
WED – What Exacerbates Demand

KISS – Keep It Simple Stupid
A paper that has resonated with me is entitled ‘Simple vs Complex forecasting: The Evidence’ (Armstrong and Green, 2015).
Here the evidence strongly suggests that complexity in forecasts actually increases risk of error. The more ‘assumptions’ you include, the worse your forecasts become.
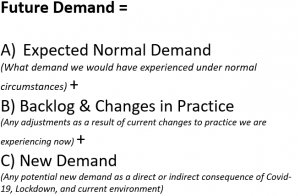
Our own simple approach for modelling demand after Covid-19 breaks down future demand into the three components pictured below:
CARESS – Change is Always Rare, Everything Stays the Same
Things are always more likely to stay the same than change. The aforementioned ‘Simple vs Complex’ paper found that the most accurate forecast model ‘most’ of the time is the naïve model – which simply states that the same thing will happen again. But people hear these catastrophised soundbites from media or hearsay and treat them as gospel.
Unless there is REAL hard evidence (not something a bloke down the pub has said) to suggest that something is going to change – assume it will remain the same.
We started our forecasts by determining what demand ‘should’ look like. Using historic observations from February 2017 to February 2020 for data on commissioned services, assessments and referrals and active plans & caseloads, we were able to use Time Series statistical methodologies to create an ‘Expected Normal Demand’ for a non Covid world. This gives us a nice solid scientific based starting point.
LOVE - Look at Observed Values vs Expected 
How does what is happening now compare to what ‘should’ happen and what has happened before?
We built our time series ‘expected normal demand’ forecasts knowing full well they would be wrong. And clearly what we have seen in April, May, June, July hasn’t been what we would normally have expected. But it is through understanding why this is different that helps us to predict what might happen next.
We have seen a significant drop in some of our services – often because of a ‘blockage’ in a pathway. For example, service referrals from an Educational setting will be nearly non-existent because of the temporary closure of schools.
We have seen, or expect to see, a significant increase in some of our services – potentially as a result of changes in people’s daily lives and circumstances. For example, we may experience an increase in things like anxiety, or financial stress.
If you can obtain a holistic understanding of ‘why’ current patterns are different to what was expected (through analysis, research, practitioner input) then you are in a better position to estimate: how long do we expect the current pattern to continue for and; what happens to the over/under demand we have been experiencing.
WED – What Exacerbates Demand
What are the drivers of demand, and how might these be affected?
This is the trickiest part because hard real evidence that is robustly comparable to the current Covid climate simply does not exist. But if we stick to our previous principles (Keep It Simple Stupid) we can attempt to build some scenarios. So what are the macro things that might impact upon demand for our services? (There is NO need to try and incorporate EVERY tiniest potential element – as for every tiny adjustment that increases your demand forecast, there will be another tiny element that decreases your demand forecast – and you will always find yourself more or less back where you started, but with 4 months of your life lost forever!)
Using childrens’ services as an example, evidence suggests that as income deprivation and poverty increases, so does the risk of requiring childrens’ social care services. And we can even use historical national data to identify the strength of this relationship through some simple regression techniques.
We can then make a semi-crude assumption (albeit borne out of evidence) that ‘for every additional 100 households in the county facing financial strain or unemployment, we can expect an additional 4 children known to the service’.
KISS, CARESS, LOVE, & WED
Putting it all together starts to move into the realm of scenario modelling rather than statistical forecasting – but the two go hand in hand. And it is finding the right blend that build confidence in forecast outputs.
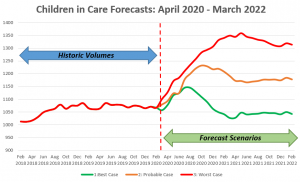
Whilst creating several possible scenarios may seem like casting a net wide – it is important to be prepared for all potential realistic outcomes. It may well be that as more time passes you get a clearer indication of what scenario pathway you are on a trajectory towards and can take action accordingly.
1 comment
Comment by Tricia Smith posted on
very good blog Stephen, you have a great way of putting things!