One good thing to have come out of lockdown has been the little bit of extra time to learn and test new things. I’ve spent a lot of my recent free time making the most of my DataCamp license, learning some new, super cool - definitely not at all nerdy – data science techniques.
If you haven’t heard of DataCamp, it’s basically an online learning resource that teaches budding data scientists, like myself, the tricks of the trade. It’s a huge resource, and with more than 300 courses available, I needed to narrow down my search to something that would be valuable to bring back to Essex County Council and ecda.
I decided to focus on geo-spatial analysis.
Geo-spatial analysis is an important skill to have in our Data Science arsenal, and it’s one that we’ve been utilising for quite a while. But we’ve not always utilised it to its greatest potential. In a lot of our collective experience, geo-spatial analysis is often reduced to the dreaded phrase “can you make me a map?”. I can’t tell you the amount of times the team here have been told that data would “look so lovely in a map”, insert eye rolling emoji!!
Yes, sure, maps are a part of it, or most of it in fact, but there is an awful lot more to this than simply making a pretty visual. I’m not against maps, per se, but I am against the idea that geo-spatial analysis is simply a fancy phrase for making a pretty picture.
So, to improve my skills, I went through a couple of courses on DataCamp (Spatial Data with R and Interactive Maps with Leaflet in R), and then saw the project “Where would you open a Chipotle?”
The aim of the project was basically to identify the best location to open a new Chipotle using interactive maps and external data to compare proposed locations on several important factors, such as proximity to existing locations, population distribution, and the distance from key transport links and tourist attractions.
I’m pretty confident that Essex County Council aren’t going to be that interested in prime locations for new fast food restaurants, but the logic behind the project got me thinking about how the techniques could be applied to our work. For examp
le, maybe we could use this data science approach to identify prime locations for new foodbanks, family wellbeing hubs, or fire stations.
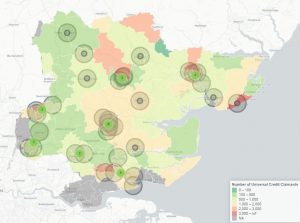 I decided to tackle the issue of foodbanks, to see how it could help in Covid-19 response planning. You can actually find and use the tool I’ve created through our Open Data platform, here.
So why am I writing a blog about this?
The main reason is that it’s an example of how the Data and Analytics team are using the spare time we have to upskill ourselves, and learn how we can apply new things to our work. There's a lot of demand on our time, but when we are able to invest some of it into developing our skills it feels great to be able to offer that back to our customers.
The other reason is that I want people to know that we can do more with geo-spatial analysis than make pretty pictures. Yes, the maps I’ve made are nice to look at and play with, but they actually tell you something. They enable you as a user or a customer to derive important information and, potentially, inform decisions that you may need to take.
If we can highlight how this sort of work can elevate and provide clear insight, then maybe we won’t be asked to make maps just because they’re pretty anymore.
Leave a comment