For those that remember the 90s they’ll remember it fondly. Footballs Coming Home, Things Can Only Get Better, I’ll Be There For You (cos you’re there for me too), Slam Your Body Down and Zig-a-Zig-Ah.
This was also the last decade where deprivation didn’t exist. Its mad to think, given how much of local government work focuses on supporting the most deprived communities, that only 23 years ago there was no such thing.
I’m not naïve enough to think that there weren’t geographies, families and cohorts that faced lots of multifaceted challenges in the 90s (although it was a glorious decade) – my point is that ‘deprivation’ as we know it now was more of an idea than something we could count or measure. It's not a hard metric like ‘life expectancy’ or ‘number of unemployed’.
The birth of the Indices of Multiple Deprivation
In the late 90s multiple experts came together to construct the Indices of Multiple Deprivation (IMD). Anyone that has worked in government know this as a staple for countless initiatives that have followed in the last twenty years. More importantly, people trust the IMD as THE measure for determining the ‘goodness’ of small geographical areas. But perhaps not everyone knows the full picture for what ‘deprivation’ actually is.
As a quick background it consists of 38 measures across 7 domains (income; employment; education; health; crime; housing; environment). Using a segmentation method called ‘prescribed binning’ several organisations created the definition using these 38 quantifiable metrics to come up with what we now all use on a regular basis.
If this was to be created today, it would probably be completely different. Or perhaps if the Jill Dando Institute were consulted on the Crime Domain (instead of University of Manchester) then we would also have a different IMD score. I’m not suggesting that the IMD is wrong or outdated, I’m saying that the outputs are one group's professional definition. And when trying to define something that isn’t easily quantifiable, you kind of have to put your trust in that group’s expertise and simply understand that if 100 experts were all set the same task you would end up with 100 different indices. But THIS is the definition we’re going with.
I personally love the Indices of Multiple Deprivation, but sometimes that lack of understanding of ‘how it’s made’ does lead to some strange interpretations.
Eg, “Can you believe that a third of the people unemployed or on low incomes reside within the bottom 10% most deprived communities?!”
Well…. Yes. Because 22.5% of the measures used to construct deprivation are based on income and employment! I’d be surprised if that wasn’t the case!
That’s like saying “Can you believe that a third of Shepherds’ Pie is Potato?!”
It’s a vital ingredient of the construct!
Defining Complexity in Adult Social Care
This brings me to ‘Complexity in Adult Social Care’.
And it started in a similar fashion. Without a measurable measure!
Local Authorities have been working tirelessly to support the growing number of people that require ongoing social care support and have managed volumes admirably through the use of preventative strategies and enablement. However, costs continue to rise and a comment we regularly heard was “the needs of those we are supporting are more complex”.
This is almost certainly true. As Local Authorities seek to increase the use of universal/community support, it makes sense that we will see more complex needs in those that still require longer term ongoing support. However, no one could really answer consistently when asked “how do you define complex needs?”
*Which of course makes it hard to measure and evidence (and therefore ultimately hard to ‘do something’ tangible)
Taking the same approach as the pioneers of IMD we attempted to quantify ‘Complexity in Adult Social Care’. There were numerous motivators for doing so. This would give us additional insight about the residents we support and the nature of their needs, plus enable effective market shaping and future planning. Further details on these motivators are covered later (as, spoiler alert, we uncovered more than we anticipated).
A social worker would be able to tell you the complexity of the needs of the people they support better than any ‘algorithm’. Absolutely. Our intention was never to replace this, rather try and take that detailed knowledge that social workers possess at an individual level to a strategic audience.
In discussion with service experts and professionals, plus drawing upon literature, we began crafting our definition. If you start by hoping you can get a concise, sound-bite-esque, fits-on-a-t-shirt definition then you’re setting yourself up to fail! (*I think the levelling-up definition is a 17 page document!)
The definition of complex was, well, complex! What was consistent was that when people were talking about complexity in care they weren’t talking exclusively about whether an individual has multiple health conditions, it was the combination of lots of different health, behavioural, societal, demographic, and geographical factors. This was about all the things that made the delivery of the care more complex, NOT solely the complex nature of specific health conditions.
After considerable iterations we ended up with a set of domains we thought captured this thoroughly:
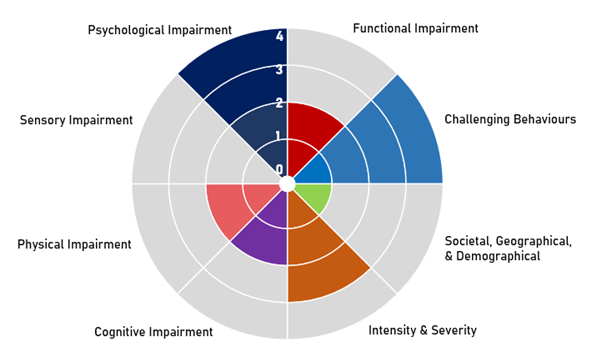
Quite often social care reports and annual-returns almost treat these domains as binary. Someone either has a cognitive impairment, or they don’t. We know this is not the case, and realistically the spectrum for all of these domains is wide – so we wanted to capture some of that.
Continuing with Cognitive Impairment as an example, we have attempted to quantify the spectrum of need. ‘Very high’ being those that are in receipt of ongoing support mainly as a result of significant cognitive impairment. ‘Moderate’ those that have not specifically approached us for support with cognition, yet have an identified diagnosed health condition that typically impacts upon cognitive functionality. And ‘Low’, no clinically diagnosed cognitive impairment, yet some characteristics or behaviours synonymous with impaired cognition.
I couldn’t possibly go through all the individual components and measures within our complexity domains, but as an example, within the Societal, Geographical, & Demographic domain we incorporated: frailty; deprivation; rural isolation and access to amenities/services; household condition/suitability; financial wellbeing; and other variables. The other domains were predominantly formed from quantitative and qualitative information captured through social worker assessments and reviews – that’s right, we used free text and case notes!
Using Natural Language Processing to explore social care assessment notes
This was somewhat of a landmark moment for us. But we weren’t just doing it to show-off our capabilities. 80% of intelligence we have on our social care cohort is recorded in text and unstructured data. This is the stuff that gives a small glimpse of that very detailed inherent knowledge that social workers possess at a granular level, and just unlocking some of that is vitally important (not least because the quantitative data alone didn’t extensively cover what we needed).
Quite simply all local authorities need to find a way of harnessing this infinitely vast amount of intelligence.
We used some simple Natural Language Processing techniques to find common words, phrases, and themes within assessment notes for each distinct cohort. We then used an approach called TF-IDF (term frequency – inverse document frequency) to isolate the themes and phrases that are uniquely important to specific service user groups. Things like “care plan” or “support” are used quite regularly across all cohorts, and don’t really tell us much. TF-IDF highlights key topics that would otherwise be lost amongst the generic language.
Below we see the important terms identified within assessment notes for service users that specifically sought support because of Cognitive Impairment(s). Words like ‘wandering’ and ‘confused’, plus themes around remembering, recognition and memory. There was also a common theme of aggression and agitation.
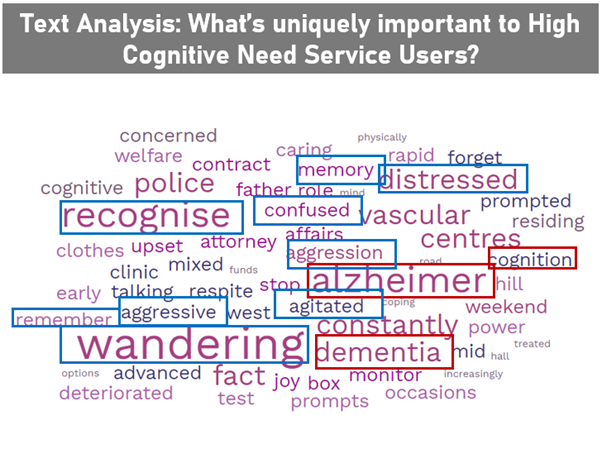
This is important as it starts to give us a bit more information on the support needs for this group – such as supporting memory and cognition – but also highlights some additional consistent characteristics that make the delivery of care more complex.
What this then enables us to do, is look for these characteristics and behaviours across our entire service user population. Suddenly we found another circa 800 people that had no clinically diagnosed cognitive impairment but had similar behaviours and therefore similar support requirements. We looked into a sample of these 800 cases in detail and found that in the vast majority there were indeed behaviours tantamount to a cognitive impairment. Now we aren’t trying to create a diagnosis tool at all, but this did unearth some hidden support needs. Typically this was because there were far greater and more dominant health needs in another domain – yet we feel its important to ensure we’re capturing this low (or possibly emerging) support need as it will make the delivery of support more complex.
What this means and next steps
I hope to be able to share the full methodology and outputs in a wider forum soon. We are still testing initial outputs and fine tuning definitions and domains, but what it currently looks like is this:
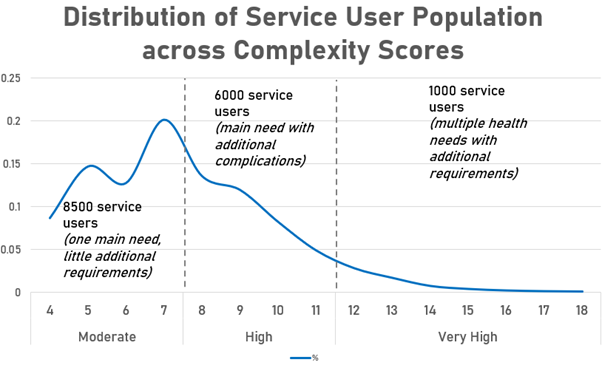
One thousand very complex cases. These are typically people who have multiple health conditions that have a significant impact on daily life, plus several additional factors that exacerbate the delivery of their care and support.
Why does that matter?
Well, to begin with time and cost. Very High residents need almost double the amount of contacts per year than Moderate cases, and are 50%+ more costly. (*And as you might expect there is a greater proportion of the highly complex cases in more intensive settings like Residential)
Then through the exploration of the assessment notes we were also able to get some new strategic intelligence on a variety of things such as the aforementioned ‘hidden needs’ plus other factors that exacerbate support needs like financial wellbeing, rural isolation, and many more.
We’ve only really scratched the surface, but next steps are to inform market shaping so that the right care is available and focus on hidden needs so that individuals’ care and support is as effective as possible.
Please reach out if you want to hear more – I love talking about this and will share anything and everything with anyone! This is my favourite piece of work I’ve ever been involved with in my 15 years at Essex County Council and can see so much value already with more to come. It was a real team effort with a dozen people from different backgrounds involved in order to try and be as robust, ethical, and transformational as possible.
I hope in 23 years time someone writes a future blog (that probably just gets automatically injected into our consciousness via a whatsapp message) about ‘the halcyon days of 2021 when complexity didn’t exist’.
1 comment
Comment by Rachel posted on
Really good blog, excited to see where this goes!