“Start where you are. Use what you have. Do what you can.” Arthur Ashe (record breaking tennis player)
Sadly many lives were lost as a result of COVID-19. Many lives were also made a little easier by the thousands of people who volunteered to help their communities at a time they needed it most.
Volunteers were essential providers of practical (shopping, prescription delivery) and emotional (befriending) support and they also saved lives by helping the most vulnerable to remain shielded at home.
So, with things slowly returning to normal we don’t need these volunteers anymore, right?! Well what if such support was to continue into the future? What could we achieve if volunteers continued to support their communities in similar ways? The possibilities are endless but with things returning to normal there is certainly a risk that we will lose this momentum and people will go back to their old lives…yes possibly… but if we can understand the risk then maybe we can start to do something to mitigate it.
So what are the risks to people ceasing volunteering and how can analysis help us to identify these risks?
A number of factors may have freed people up to help with volunteering during lockdown and similarly the return to some level of normality may also have the opposite effect. Luckily in Data and Analytics (D&A) we have many tools at our fingertips that help us profile such factors, one of these is Customer Mosaic segmentation.
This is a powerful tool that provides detailed insights about the lifestyles and behaviours of people in Essex. Coupled with the excellent skills we have in D&A we were able to profile volunteers who had signed up to the Essex Welfare Service and apply a risk profile.
N/B The Essex Welfare Service was just one way people could sign up to volunteer. The NHS goodsams app was also utilised to enable volunteer sign up.
Using Customer segmentation Mosaic we identified some key risk factors…
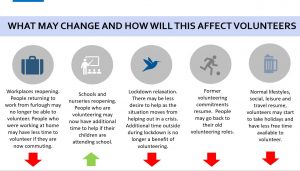
We then stratified risk
By profiling the volunteers into groups with similar characteristics we can calculate their risk score based on their lifestyle and behaviours – which gives us an idea of how likely they are to reduce their volunteering.
Once the numbers had been crunched we found that the most “risky” (as “most likely to reduce volunteering capacity” is a bit of a mouthful) 11 groups (top quintile) made up a quarter of the volunteers. The map below shows where the highest risk is at LSOA level. If you want to look at the mosaic groupings in more detail these can be found here.
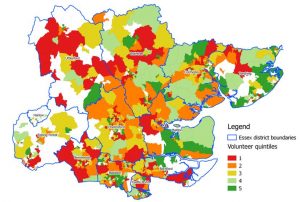
Now we knew where the high-risk volunteers were and what the barriers to continuing were. And we had valuable geographical insight that enabled targeted actions to be taken.
This analysis raised a number of questions:
- What can we do to help them continue volunteering longer term (even if at a reduced level)?
- Can we offer support to those who are volunteering in lower risk groups to enable them to pick up some of the needs that might not be met?
- Could we identify and recruit more volunteers in anticipation of a reduction?
These questions were a great conversation starter and have prompted discussion around how we maintain and retain interest from our new volunteers and discussion on how we utilise community capacity to help meet future demand in similar situations. It has also prompted discussion on how volunteers can be used to help solve demand challenges in statutory services and to help people stay living in their own homes when the need for such support prevents them from doing so.
Leave a comment