We talk A LOT about the potential for data within our world, whether that’s with our data colleagues, across the services in our organisations, together with other public sector partners locally or nationally with our data peers. What we don’t do so much of is talking to our citizens - the people we serve - about analysing the data we have available about how they use our services.
It makes sense therefore that as a prerequisite to delivering a qualitative research programme exploring citizen attitudes towards data sharing, and given our area of expertise, that we wanted to explore the volume of data available from the annual Essex residents survey. Between the 4th March and 27th April 2020, the Essex Resident’s survey was distributed across the county receiving a total of 3,021 responses – a summary report will be published on our Open Data platform very soon. In the many questions included in the survey were one or two asking how people feel about the sharing and use of data to identify issues early, intervene and protect and prevent people from harm – our nirvana.
Making sense of it all
The survey responses generated thousands of rows and columns of numbers that really don’t make sense to anyone at all without some further exploration! Taking a deep breath and unleashing our data superpowers our work began, and we asked ourselves what’s the first step to understanding this data? Recode, recode and finally recode!

Unlike Russian hacking or cyber security, recoding in this context is to look at each variable and ensure that they are firstly in an acceptable and consistent format. It can get a bit messy with open ended questions such as what is your postcode? With one answer in a variety of different formats, CM1 1QH, cm1 1qh, CM11QH etc. We call this the cleaning process to avoid any problems that can occur with duplications or discrepancies in the data.
Now for the exciting part of recoding. Our particular focus for the variables that we wanted to recode were respondent’s demographics. Take income for example: We asked each resident ‘What is your current household income before tax?’ This a fantastic question because it has the potential of going from a variable to a measure by using the superpower effect of recoding. Looking at average income levels for Essex we created a 5-point scale for income level that ranged Very High, High, Medium, Low and Very Low. Now, if we wanted to investigate how one’s financial situation could have an impact on their views about data sharing, we have a very useful measure that can provide us some insight! This is such an incredibly important step that transforms variables into measures that can then be used to test relationships. Age, gender, deprivation levels are all amazing variables that can be very useful to recode!
Where is this relationship going?!
Once the recoding of all variables was done, creating crosstabulations was the next step. This allowed us to see whether any relationships seemed to exist and what their “direction” might be. We have an example here about respondents’ opinions on how trustworthy ECC is and their attitudes towards data sharing to protect vulnerable people from harm:
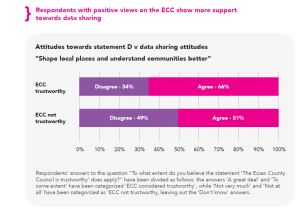
The “direction” of the relationship clearly seems to be: higher levels of trust in local government = more positive views on data sharing. It was just the same case, we noticed later, for stronger sense of community and more positive views on local democracy. The relationship to area deprivation, we found, had just the opposite “direction”: the higher the deprivation levels, the more negative were people’s data-sharing views.
What’s really important?
So, are these relationships really “a thing”? To find that out, significance testing, another of our superpowers came to the rescue - the Chi2 test to be more specific. After running many Chi2 tests, the results were out: views on ECC, views on local democracy, sense of community, and area deprivation level hold a significant relationship with data sharing views. A few logistic regressions that included all these variables (and others such as age, health status, etc) showed these relationships remain significant even when adding other factors into the equation.
Through this analysis we were able to find clear evidence that these factors play a part in how people’s data-sharing attitudes are moulded. Finally, no matter how we sectioned the data in our search for significant relationships, it was always the case that more people were open to data-sharing than not. Knowing that how much people trust local government and to what extent they feel involved in local democracy influences their opinion about data sharing, is crucial insight into how we might engage with them in future.
To learn what the qualitative research told us read Part 2 of our blog here.
Leave a comment