This year has been shall we say - very different to what we are all used to, however we would like to share a bit of positivity around some great work that the Open Data team have delivered in this past financial year, and we'll limit the use of the C word as much as possible! Ok ok that's going to be tough so we will start with it and that’s it we PROMISE!
The introduction of Shiny apps
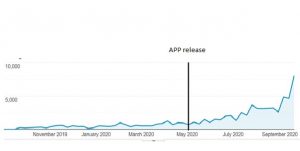
Interactive tools have always been popular for users as they give you a visual story of data rather than a huge excel spreadsheet that is sometimes tough to trawl through. This app here (Local COVID-19 Cases and Deaths by district) was our first ever shiny product and during the peak of Coronavirus we had a huge increase in numbers:
- Page visits increased from 700 visits to 8,000 a Week
- Unique visitors increased from 500 to 5,000 a week
- Received 32.61% of total page views on open data.

This chart shows the growth of visits to the platform since this app has been created. We have now produced other shiny products and have our very own Shiny Genius within the team, these can all be found on our platform.
On the cutting edge
Shiny apps would not be possible without our ongoing commitment to innovation and progress and this year has seen some major developments. We harnessed the possibilities of Amazon Web Services to build and deploy our shiny server and using the power of PowerBI and Sharepoint to set up new automated data pipelines with the Essex County Fire and Rescue Service to share incident data.
Using these modern tools and techniques we enable the public to have the best content and most up to date information, without committing ECC and ECFRS staff to lengthy and tedious refresh schedules.
Transparency, Collaboration, Innovation
Now if you’re a regular visitor to our platform you will recognise these three key words. Our new partnership work with Essex County Fire and Rescue Service (ECFRS) optimises this in all aspects, and we’re excited to launch the new ECFRS tool next week, so keep a look out for it.
- Collaboration – “the action of working with someone to produce something” Check! - The Open Data team and ECFRS have worked together to create an interactive tool.
- Business transparency – “is the process of being open, honest, and straightforward about various company operations” Check! – All data will be published onto the Open Data Platform in the coming weeks.
- Innovation - “the creation, development and implementation of a new product, process or service, with the aim of improving efficiency, effectiveness or competitive advantage” Check! - The interactive tool is powered by Microsoft’s Power BI and features the last three years’ worth of open incident data.
Our newest recruit
We were delighted to welcome Amin to the team who is our Data and Analytics apprentice and has been a great addition to the team - he is already creating dashboards and here it is Unemployment and Job Market profiles.
The aim of this dashboard is to provide a detailed profile of employment in Essex by taking the figures of jobs available in districts, what jobs the residents have in these districts along with unemployed in districts and visualising this data to provide comparisons over; year, industry and district.
What’s next and our promise?
We are currently redesigning the Essex Open Data platform and engaging with users to understand and better meet their needs so look out for that!
We promise to keep publishing new, exciting datasets, and building interactive tools. We’re going to continue the great work already started with existing/new partners to bring new data to Essex Open Data, making it a central portal for all data needs.
Finally, we would like to thank everyone that has used the platform, the team look forward to continuing the great work that has transpired so far. We couldn’t have produced half this work if it wasn’t for you all! 2021/22 will be another year of hard work, progress and hopefully meeting our colleagues and partners for a warm beverage or even a cold one!
Thanks Again
The Open Data Team