At Essex Police we make a commitment to our colleagues and to the communities across the county that we serve to use intelligence, data, and evidence to make decisions about the services we deliver to prevent harm and protect the most vulnerable.
There are hundreds of departments within Essex Police, and more than 180 systems that hold data, together that creates thousands of processes that require data and analysis, all of which is supported by just one team of analysts. Thankfully technology has enabled us to move on from the old, and limiting, ways of fulfilling our business needs manually to empowering people to self-serve, giving them easy access to data when they need it without having to consult with an Analyst.
Creating dashboards enables us to bring together a huge volume of data more quickly and make it meaningful for many of our internal customers. Dashboards give us more functionality to present data and therefore support us to guide colleagues through analysis with tailored, interactive stories that combine data, content, and insights in a way that makes sense to them, while governing access to data, and which ultimately helps our officers to make decisions.
Data just makes sense when it’s in a dashboard. Having a practical tool to explore my data prevents me from getting lost in all the detail.
As Sir Ian Diamond, the UK’s National Statistician, recently said at the Essex Be Part Of The Equation event, “dashboards are an increasing trend and absolutely brilliant” and can be great for aiding transparency and communicating complex data in a clear and simple format. He’s an enormous fan of these powerful communications tools, and so are we at Essex Police, but I know many other Analysts that view them as an onerous task, so I’m here to explore whether it’s possible to build a dashboard in a day?!
Let me start answering that by sharing our dashboard development process:
1. Understand the requirements of the customer/business and understand the data available – we use the Nesta four step model to define the need: identify the specific problem; be clear about the data product; identify accessible data; define the action.
2. Wireframe and design – Based on what you’ve learned from stage one present your initial mock-up for the dashboard to the customer for feedback to prevent any drastic changes further down the line
3. Prepare the data and sort out any quality issues – it’s really important to ensure the data is right by going through a rigorous quality assurance process
4. Data modelling – start feeding your data into the dashboard, joining your datasets together and creating measures that will allow you to build your visualisation
5. Visualisation – decide what visuals and graphics work best for the data, this often requires experimentation!
6. Testing – test your product through another reputable source and use it to validate your figures and consult further with the customer
7. Deployment – provide a guide to enable people to use the dashboard, and context on the datasets and what the dashboard doesn’t do! Allow some time for snagging.
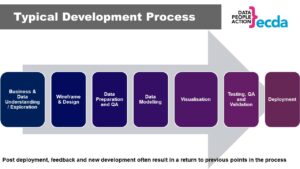
As you might expect, building a dashboard is quite often an iterative process, and once people are using it tweaks can be made to help them to get more meaning from the data. Often delivery of the product also opens their minds to all the new possibilities and additions they’d like in the dashboard!
Data visualisation has been a big growth area for software developers. Alongside many other public sector organisations in the County, we have moved to using Microsoft Power BI which has some great advantages - it is relatively cheap (the desktop App is free), can access data in a multitude of formats and you can build a basic but impressive dashboard with only a small amount of training. Alternatives include the free R Shiny using the R package, Google’s Data Studio and more expensive options such as Tableau and QlikView.
Recent dashboards that we’ve created include one to aid senior officers in the monitoring of volumes of crimes, arrests, stop and searches by ethnicity, age and gender, another has been on hate crime to enable Police to share data with the external Independent Advisory Groups which support with the delivery of the Essex Hate Crime strategy.
As the dashboards reach more people demand is increasing, and we recognise that we need to support our colleagues to make the best use of the insight presented. The popularity of our approach gives us some additional opportunities to streamline resources investing in creating the dashboards:
• Having data on the cloud so that it provides access to live data and automatically updates dashboards provides a huge time saving and frees up Analyst resource.
• Exploring the benefits of machine learning and the opportunities it presents for analysing large volumes of untapped text.
• A strategy for dashboard development is now required to support business priorities, rather than satisfying ad-hoc requests.
• Delivery of a data literacy programme for colleagues. We can’t provide the volume of support to explain the dashboards to the volume of internal customers that have access, we need to provide additional support to ensure people interpret data correctly.
• External publication of the dashboards, where appropriate, will allow greater access to the data available and reduce Freedom of Information requests.
So, in summary and returning to the question, is it possible to develop a dashboard in a day, I’m going to answer a resounding yes! And yes, I have tried it and achieved it! Just last week I produced a dashboard in a day to support our current priority to respond to concerns about safety in public spaces.
To ensure you’re successful you will need to have two things in place first:
1. A mature dataset – data that you know really well, you know the data quality issues, gaps, how to format it quickly or its already a dataset you’re using elsewhere
2. Clear objective and scope – to achieve this in a day you’ll either be generating it yourself, or you know your customer and their problem statement inside out.